CrowdMap
Built at Meta Global AI Developer Hackathon · Oct 26, 2026 · Remote
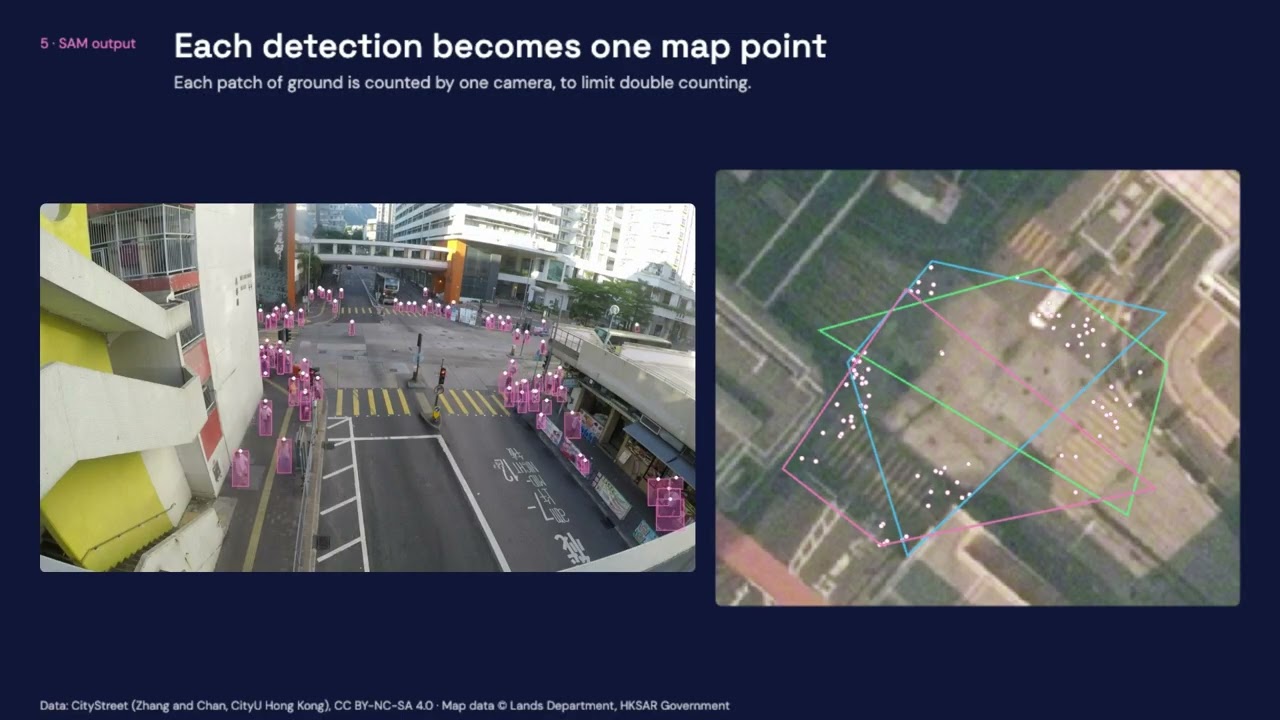
CrowdMap helps people understand how crowds move through real places. Most camera systems show separate views that someone has to watch and interpret. CrowdMap brings those views together on one map, showing where people gather and which way they walk. Venue operators, campus planners, transit agencies and event safety teams make decisions about barriers, signs, staffing and stops every day. Yet they often rely on intuition, occasional counts or hours of footage reviewed by hand. They have cameras, but lack a clear picture of movement across the whole site. Dedicated sensors and custom vision systems can help, but often require new hardware or training for each location. CrowdMap works with ordinary footage. A site provides a top-down map, four matching ground points per camera, and camera position and height where needed. The system produces crowd heat maps in people per square meter and flow arrows in people per minute, drawn on the real map. Areas no camera can see appear in gray, so users can tell where measurements are available. For us, pushing the frontier means giving cameras a capability beyond recording: turning what they see into measurements of a physical system. SAM 3.1, accessed through the Meta Model API, detects people from a text prompt and tracks their movement. Our geometry pipeline converts those observations into positions, densities and directions on the ground. Moving from a busy Hong Kong junction to a Swiss campus required new camera geometry, without retraining the model. Getting this to work took more than connecting an API. We split frames into overlapping tiles to find small, distant people, process video in short chunks to capture new arrivals, and join tracks across short gaps. We also handle overlapping camera views to limit double counting. Cached requests, resumable runs and budget controls keep experiments practical, with estimated inference costs of about $0.12 per minute of video per camera. We checked the results against official dataset labels. On 200 CityStreet frames from three cameras, heat map correlation reached 0.81, and 72% of people were placed within 2 meters. On SCOUT’s eight-camera campus dataset, 85% of predicted flow arrows matched a reference arrow, with a median direction error below 2 degrees. The evaluation also showed where work remains. Low detection recall on SCOUT makes flow direction more reliable than crowd volume. Settings were tuned on the same footage, so these are development results rather than a blind test. The pipeline runs from footage to exported map layers, and the demo shows cached results from real data. Our next step is to help teams compare the same place before and after a change. They could move a barrier, adjust a sign or reposition staff, then measure how movement changes at the next event. CrowdMap gives them a way to test those decisions and improve the spaces people share.