Demir Ege Ortac
Built at Built with Claude: Life Sciences · Jul 7, 2026 · Remote
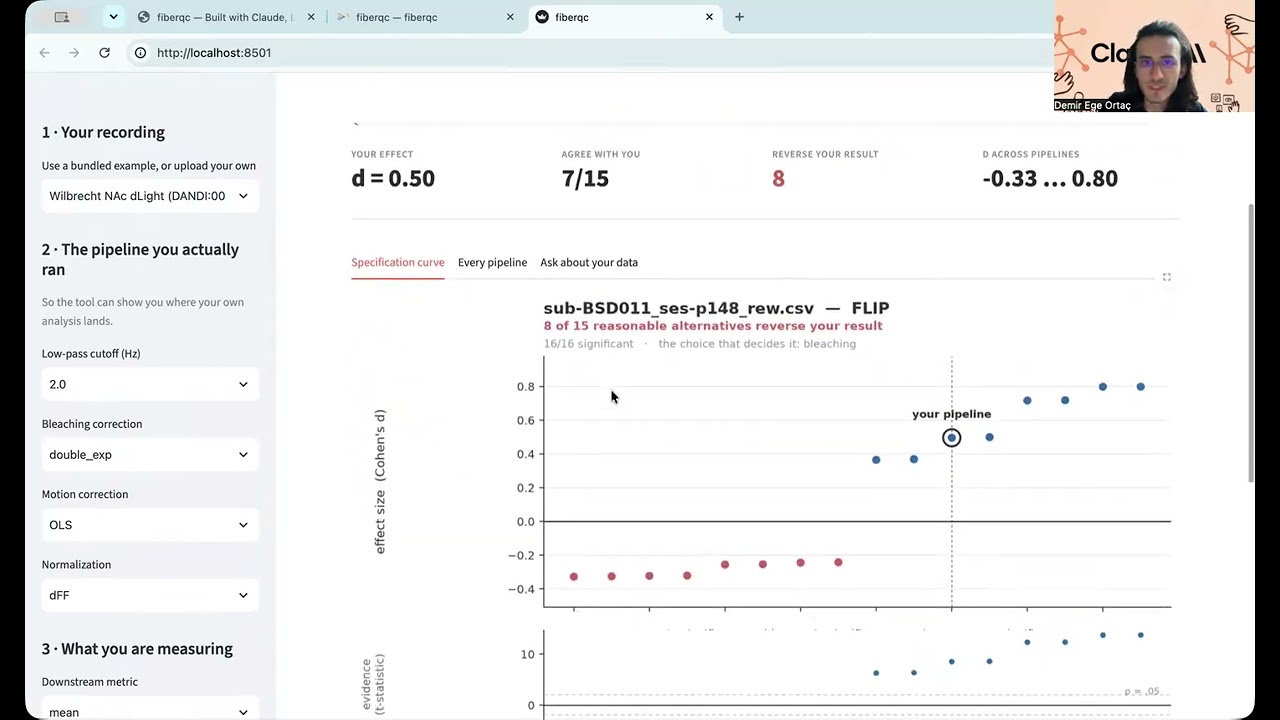
I ran my tool on published, peer-reviewed data from the Wilbrecht lab at Berkeley (DANDI:001340, dopamine in the nucleus accumbens during reward learning). 8 of 15 reasonable preprocessing pipelines REVERSE the sign of the result. All 16 are significant. The choice that decides it is the bleaching correction, and a researcher would probably never register it as a choice at all. fiberqc is a quality-control tool for fiber photometry, the technique used across systems neuroscience to record dopamine release in behaving animals. THE PROBLEM Before a raw recording becomes a result, it passes through a chain of preprocessing decisions: filter cutoff, bleaching correction, motion regression, normalization. Each one is defensible. Each one is somewhat arbitrary. The field's own reference primer (Simpson, Akam, Patriarchi et al., Neuron 2024) states plainly that there is no systematic comparison of these choices and no established best practice. So results get published without anyone checking whether they depend on a filter setting that was picked without thinking about it. WHAT IT DOES fiberqc runs the same analysis through every reasonable pipeline at once. You declare the pipeline you actually ran. It locates your result in that space, tells you how many defensible alternatives disagree with it, and names the choice that decides the outcome. THE FINDING The eight pipelines using high-pass bleaching correction find a significant decrease (d = -0.33). The eight using a double-exponential fit find a significant increase (d = +0.50). Nothing else flips the sign: not the filter cutoff, not motion correction, not normalization. A researcher would draw opposite biological conclusions depending on that one decision. WHAT THE TOOL FOUND IN ITSELF Running on independently published data exposed three serious bugs in fiberqc. Each is fixed, and each fix ships with a regression test that fails without it. 1. The verdict counted p-values but ignored sign, so a result where half the pipelines found a significant increase and half a significant decrease was labelled ROBUST. A QC tool that marks a dangerous result as safe is the worst failure it can have. 2. Non-uniform sampling was accepted silently. A 140-second LED-off gap was being filtered as if it were continuous signal, and that step discontinuity inverts the measured response. 3. Only the t-statistic was reported. But t = d * sqrt(n), so a trivially small effect over hundreds of trials looked overwhelming (Chen et al., 2017). Magnitude now leads, and the t-statistic is shown as the evidence for the effect rather than as the effect. Three independent labs (Akam/Blanco-Pozo, Lerner/GuPPy, Wilbrecht/DANDI). pyPhotometry, TDT and NWB formats. 29 tests, green on Python 3.10 to 3.12. API docs, CI, MIT.
