ChartAudit
Built at Meta Global AI Developer Hackathon · Oct 26, 2026 · Remote
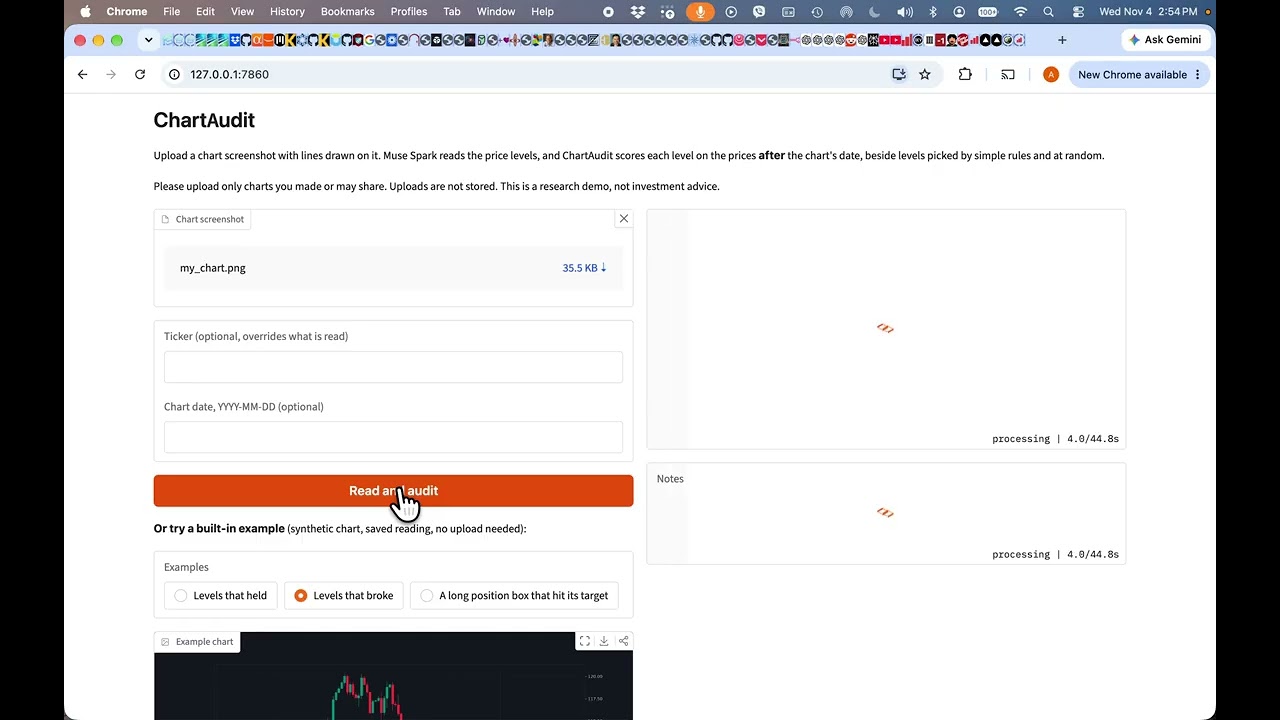
Traders draw lines on charts every day: support, resistance, zones, entries and stops. Looking back, the lines always seem to work. ChartAudit asks the honest question: after the line was drawn, did price actually respect it? Upload a marked up chart screenshot. Muse Spark reads the ticker, the date, the price axis and every drawn level, zone and position box into exact prices. ChartAudit checks that the axis was read correctly against the real closing price, then scores each drawing only on the daily prices after the chart's date, next to lines picked by simple rules (swing pivots) and at random on the same chart. Every hold rate carries a 95% interval, so "no detectable advantage yet" is a result you can see. I ran it on 51 real charts from one trader's published analysis. Muse Spark read all 51, all 43 charts with drawings passed the axis check, and drawn levels held 24% of the time when price reached them, against 26% to 38% for pivot and random levels. The intervals overlap, so on this sample the drawn lines showed no detectable advantage over random ones. That is the answer hindsight never gives you. Run the demo page locally in two commands (see the README): three built-in examples work with no upload or API key, or upload a chart you drew.