London Pipeline
Built at Meta Global AI Developer Hackathon · Oct 26, 2026 · Remote
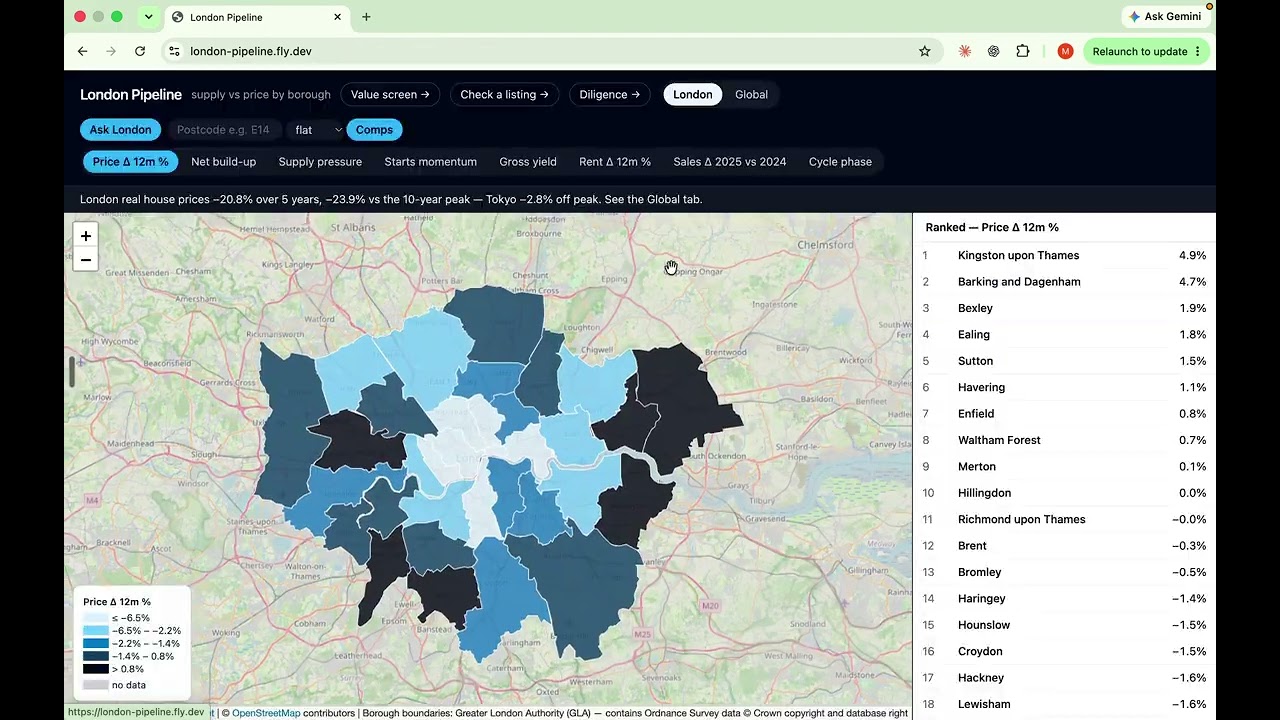
London's housing supply data is public but scattered: Land Registry prices in one place, MHCLG starts and completions in another, planning approvals in the GLA's Planning London Datahub. As the real estate analyst at the Loughborough Student Managed Fund, I wanted to see where new supply is building up before it hits prices. London Pipeline puts all 33 boroughs on one map with an analyst you can question in plain English. What it does: - Borough cycle map: each borough classed as recovery, expansion, hypersupply or recession from 12-month price change and supply pressure, with Muse Spark explaining the call in one paragraph. - Ask London: plain-English questions ("Which boroughs have the most units approved but not started?") answered by a tool-calling agent over borough, street, global and risk data. Every figure in the answer is checked against the tool results. - Street comps: a size-adjusted price per sq m fair range for any London postcode, built from 4.6m EPC certificates matched to Land Registry sales. - Value screen: neighbourhoods priced at least 10% below their borough where momentum is ahead of the borough. - Area Risk Score: 0-100 from 10 public signals (flood, air, noise, schools, transport, development pipeline and more), with buyer and investor lenses. - Analyst memo and listing check: a verified one-page call per borough, and a fair-price verdict on pasted listing text. Built solo during the event, all data open (OGL and similar). Live at https://london-pipeline.fly.dev. For information only, not investment advice.